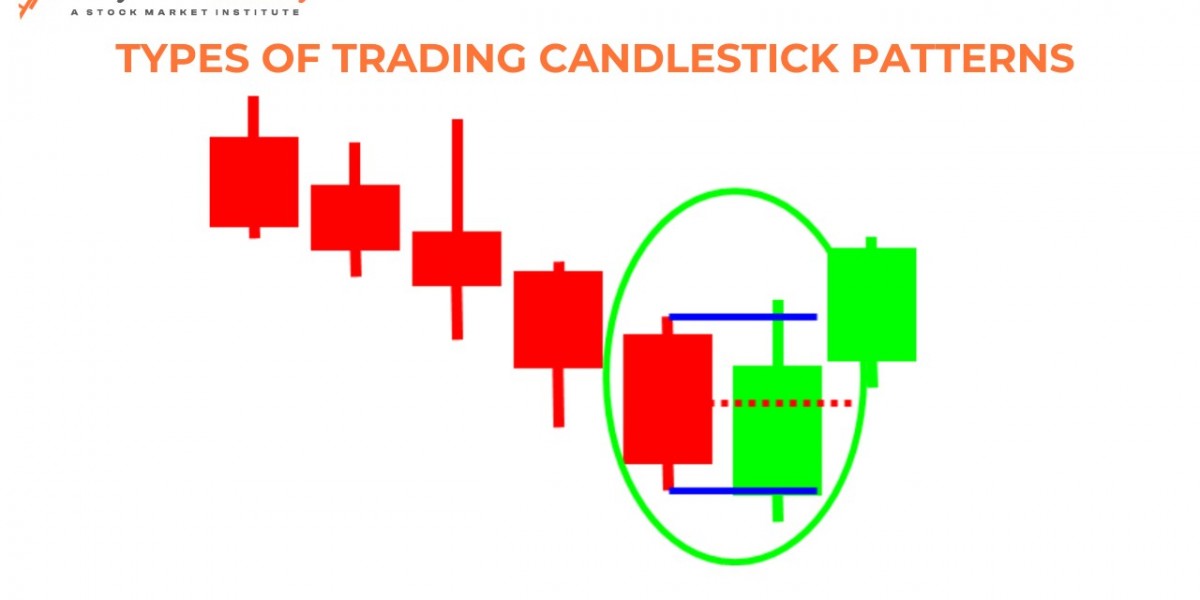
Types of Trading Candlestick Patterns
Introduction
If you've ever looked at stock market charts, you’ve probably seen those tiny red and green bars called candlesticks. But what do they mean? Candlestick patterns are like the heartbeat of the market, showing traders when to buy, sell, or wait. Understanding these patterns can be your secret weapon in stock trading. Whether you're new to trading or want to refine your skills, mastering these patterns can help you make smarter decisions.
In this article, we’ll break down the different types of trading candlestick patterns in a simple, easy-to-understand way.
Discover key trading candlestick patterns to improve your trading skills. Join the best stock market trading courses in Delhi. Enroll in a share market course Delhi today!
What Are Candlestick Patterns?
Candlestick patterns are visual representations of price movements in the stock market. Each candlestick shows four key prices: opening, closing, high, and low. Traders analyze these patterns to predict market trends and make informed decisions.
Why Are Candlestick Patterns Important?
Understanding candlestick patterns can help traders identify trend reversals, continuations, and potential breakouts. This knowledge can give you an edge in the stock market.
Basic Candlestick Components
Each candlestick consists of:
Body: The thick part, showing the open and close prices.
Wick (Shadow): The thin lines extending from the body, representing the highest and lowest prices.
Color: Green (bullish) means the price went up, and red (bearish) means it went down.
Types of Candlestick Patterns
Candlestick patterns can be categorized into three main types:
Single Candlestick Patterns
Multiple Candlestick Patterns
Continuation Patterns
Let’s explore these in detail.
Single Candlestick Patterns
Single candlestick patterns provide immediate trading signals. Some of the most common ones include:
Doji: A sign of market indecision.
Hammer: A bullish reversal pattern appearing after a downtrend.
Shooting Star: A bearish reversal pattern signaling potential downtrend.
Bullish Reversal Patterns
Bullish reversal patterns indicate a shift from a downtrend to an uptrend. Examples include:
Engulfing Pattern: A large green candle completely engulfs the previous red candle.
Morning Star: A three-candle pattern showing a transition from bearish to bullish sentiment.
Piercing Line: A bullish reversal signal when a green candle closes above the midpoint of the previous red candle.
Bearish Reversal Patterns
These patterns signal a shift from an uptrend to a downtrend. Some common ones are:
Bearish Engulfing: A red candle completely engulfs the previous green candle.
Evening Star: A three-candle pattern indicating a bearish trend.
Dark Cloud Cover: A bearish pattern where a red candle closes below the midpoint of a previous green candle.
Continuation Patterns
Continuation patterns suggest that the existing trend will continue. Examples include:
Rising Three Methods: A bullish continuation pattern where small red candles appear within two large green candles.
Falling Three Methods: A bearish continuation pattern with small green candles inside two large red candles.
Common Mistakes in Reading Candlestick Patterns
Many beginners make mistakes while interpreting candlestick patterns, such as:
Relying only on candlestick patterns without considering market trends.
Ignoring volume indicators.
Overtrading based on false signals.
How to Use Candlestick Patterns in Trading?
To effectively use candlestick patterns, follow these steps:
Combine them with technical indicators like RSI and MACD.
Always check trading volume.
Look for confirmation before making a trade.
Best Tools to Analyze Candlestick Patterns
Some of the best tools for analyzing candlestick patterns include:
TradingView – User-friendly charting software.
MetaTrader 4 & 5 – Widely used for forex and stock trading.
ThinkorSwim – Great for in-depth technical analysis.
Learning Candlestick Patterns – Where to Start?
If you're serious about stock trading, consider enrolling in stock market trading courses in Delhi or a share market course Delhi. These courses provide structured learning and real-world trading strategies.
Conclusion
Candlestick patterns are a powerful tool for traders. By understanding their meaning and usage, you can make more informed trading decisions. Whether you're just starting or looking to improve your trading strategy, mastering candlestick patterns can set you apart from the rest. Keep practicing, stay updated, and never stop learning!
Frequently Asked Questions (FAQs)
1. What is the most reliable candlestick pattern?
The Engulfing Pattern and Morning Star are considered highly reliable for trend reversals.
Can candlestick patterns predict market movement accurately?
Candlestick patterns provide strong signals but should be combined with other indicators for better accuracy.
How long does it take to learn candlestick patterns?
With consistent study and practice, you can grasp the basics in a few weeks and master them over time.
Are candlestick patterns useful for beginners?
Yes, they are beginner-friendly and provide valuable insights into market trends and price action.
Where can I learn more about candlestick patterns?
Enrolling in stock market trading courses in Delhi or a share market course Delhi can be a great way to learn from experts.